Comparing Passive House standards to baseline codes. Task 1: Methodology & Modeling Parameters.
A Passive House Network Report · RDH Building Science for PHN · November 2023 · Download the PDF · All reports
Published in 2023 as the method and model inputs for the study, before any modeling. The results are in Task 2: Multifamily Residential Buildings.
On this page: 1 Introduction and Background · 2 Methodology · 3 Modeling Tool Comparison · 4 Proposed Modeling Parameters · Notes
1 Introduction and Background
As policymakers across North America accelerate toward low-carbon buildings, the numerous design and modeling approaches, certifications, and standards variety can be challenging to navigate. The Passive House Network (PHN) seeks to provide a clear understanding of key energy efficiency standards that will empower policymakers to design programs, incentives, and policies that drive toward low-carbon buildings with a reliable understanding of the outcomes. This work also provides invaluable information to building owners, developers, and design professionals to better understand the various performance paths and modeling approaches.
The goal of this study is to provide a comparison of all current Passive House certification standards in North America, compared to other commonly used energy performance standards. In alignment with this goal, the study will illustrate differing results generated by various modeling software tools.
The study will compare multifamily and commercial building outcomes for each standard and certification program listed in this section, across North American climate zones.
The comparison study will occur in four phases, with each phase focusing on specific building types and/or climate zones. This report summarizes Phase 1, focused on multifamily residential buildings (excluding California).
1.1 Modeling Tool Compatibility
Standards such as Passive House and some recent local building codes use enclosure-first principles and use different energy modeling tools for compliance. As policies base performance levels on existing programs like Passive House and LEED, there is a need to better understand how the different modeling tools compare. This is a challenging task because, in addition to differences between modeling tool algorithms, each policy and standard typically references its own set of standard assumptions and protocols.
Different whole-building energy modeling software inherently do not align perfectly as they are fundamentally different programs with different algorithms—EnergyPlus™, for example, is an hourly energy simulation program, while PHPP and WUFI Passive (Wärme Und Feuchte Instationär – which translated means heat and moisture transiency) use monthly/annual degree day calculations—yet, some adjustments can be implemented to make the results more comparable. Some previous efforts to compare programs and standards have led to inconclusive results due to the significant differences between the modeling approaches1,2.
The work in this study will be valuable to jurisdictions that have adopted or are considering adopting one or more energy efficient building codes/standards such as Passive House or a performance-based code that leads to net-zero ready levels of annual energy consumption. The results will help authorities set requirements and assess compliance based on established standards, with an understanding of how different modeling tools and protocols compare. This work will also help building owners, designers, consultants, and project teams to understand how different standards and certification programs compare in terms of building energy performance, and to select the best approach for their project.
1.2 Passive House Institute (PHI)
The Passive House Institute (PHI) is driving innovation in high performance building enclosures.3 PHI’s certification programs (version 10), referred to herein as the International Passive House standards, include requirements for energy efficient buildings via the following metrics, all with specific definitions and calculation procedures set by PHI:
- Heating Demand4 (kWh/m²TFA/yr) or Heating Load5 (W/m²TFA)
- Cooling Demand6 (kWh/m²TFA/yr)
- Maximum Primary Energy Renewable7 (PER) or Primary Energy8 (PE) (kWh/m²TFA/yr)
- Minimum airtightness requirements (ACH @ 50Pa)
- Requirements for thermal comfort and hygiene
Specific certification requirements vary, for example PHI sets different criteria for new construction versus retrofits, high density, and buildings with unique or high-energy end-uses; there are also different performance tiers depending on the goals of the project team.
The International Passive House standard was developed in Germany and has been widely adopted, globally, as a method for achieving extremely low energy consumption in single-family dwellings (SFDs), multi-family residential buildings, and commercial buildings. The International Passive House standard has been widely adopted in climate zones similar to the inland temperate climate of Germany yet has proven to be more difficult to achieve in significantly colder climates. For example, in Europe the majority of certified buildings are in regions between 40° and 60° latitude, with only a handful in Scandinavia above 60° latitude. In North America, there are currently no PHI-certified buildings farther north than climate zone 7.9
1.3 Passive House Institute US (Phius)
Passive House Institute US (Phius) was founded in 2007 to train consultants and certify projects based on a climate-tailored passive building standard. Phius aims to decarbonize the built environment by making high-performance passive buildings the market standard. Phius certifies both residential buildings and commercial buildings. As of 2023, over 175 multifamily projects are Phius-certified, spread out over 42 states and provinces.
Similar to PHI, Phius programs (version 2021) typically include requirements via a set of performance metrics10:
- Annual Heating and Annual Cooling Demand (kBTU/ft².yr)
- Peak Heating and Peak Cooling Load (BTU/ft².hr)
- Air Permeability (CFM/ft² @ 50Pa or 75Pa)
- Net source energy demand (kBTU/ft²/yr)
- Thermal comfort
Specific certification requirements vary depending on building type (residential or commercial), location, density, and with different energy generation tiers depending on the goals of the project team.
Originally developed based on PHI, Phius has in the past decade differentiated itself from its German counterpart to be more tailored to passive design challenges in North America, such as introducing different energy demand requirements for heating and cooling depending on the local climate. For example, a Phius project in San Francisco would have different heating and cooling demand requirements than one in Boston.
Phius also has an alternative certification path for small residential single-family and townhomes, based on prescriptive requirements where Phius provides a checklist for equipment and material performance characteristics that the project must meet11.
1.4 IECC, ASHRAE, and LEED
1.4.1 IECC
The International Energy Conservation Code (IECC) provides minimum energy efficiency requirements for buildings. The code is developed by the International Code Council, a global source of codes, standards, and building safety regulations referenced in over 100 countries. IECC includes both a prescriptive and performance-based approach. They collaborate with ASHRAE on developing their codes and standards to increase awareness of energy efficient buildings12,13.
1.4.2 ASHRAE
The American Society of Heating, Refrigeration and Air-Conditioning Engineers (ASHRAE) was formed in 1959, and today focuses on building systems, energy efficiency, indoor air quality, refrigeration, and sustainability within the built environment. Their standard 90.1 (Energy Standard for Buildings Except Low-Rise Residential Buildings) is frequently referenced in the design of multifamily and commercial buildings. This standard establishes minimum energy efficiency requirements for design, construction, operation, and maintenance, as well as the use of on-site renewables. The ASHRAE 90.1 standard (versions 2016 and 2019) includes both prescriptive, trade-off, and performance approaches; the prescriptive and trade-off approaches prescribes a set of specifications for minimum performance, such as air leakage, building enclosure R-values by climate zone, lighting intensity, and HVAC efficiencies. The performance approaches require whole building energy modeling to confirm a building meets or exceeds the standard relative to a theoretical baseline or reference building14.
1.4.3 LEED
LEED is a North American sustainability certification program. Tiers (e.g., LEED Certified, LEED Gold, LEED Silver, LEED Platinum) are awarded based on a point system and a category of points are awarded based on energy performance. Some categories involve optimizing energy performance and aiming to use more renewable energy sources. Baseline models (and minimum energy performance) are set out per existing PNNL and ASHRAE guidelines. The project team can choose the level of ambition for the proposed design in optimizing energy performance, and a better performance yields more LEED points.
LEED v4.1 energy credits reference ASHRAE 90.1-2016 Appendix G. Greater percent savings results in a higher number of LEED points. For new Building Design + Construction (BD+C) certification projects (except schools and healthcare), up to 18 points are available with the maximum points based on 45% energy cost savings and 80% GHG emissions reductions.15
2 Methodology
The scope of work for this study is being completed through five tasks, summarized below.
- Task 1 Refine Methodology, Review Standards, and Summarize Model Inputs to ensure alignment with PHN and project stakeholders prior to modeling. This is an important step to develop the most applicable building archetype and design strategies modeled for each climate and standard, and to collect input from stakeholders to inform the modeling.
- Task 2 Energy Modeling to illustrate energy and carbon performance outcomes for the various standards. This includes modeling using EnergyPlus, PHPP, and WUFI Passive of various design scenarios and climate zones.
- Task 3 Draft report for review by PHN and NREL. This communicates preliminary results and seeks input from stakeholders in a feedback loop.
- Task 4 Presentation of preliminary findings to PHN and project stakeholders, enabling additional feedback and discussion.
- Task 5 Final report to present results.
The sections below provide additional details on Tasks 1 through 5.
2.1 Summary of Methodology
The following is a summary of the methodology.
Task 1 Refine Methodology, Review Standards, and Summarize Model Inputs
Task 1 acts to review and refine the proposed methodology for this study, review the standards and certifications included as part of the study, and compile the energy model inputs for Task 2. Task 1 is critical to ensuring the understanding and alignment of goals for this work between RDH, PHN, and other project stakeholders.
This task summarizes the Passive House certifications and commonly used codes and standards in North America. This review captures the following for each certification or standard:
- Typical implementation strategy of the certification or standard (i.e., when/where is it commonly used).
- Compare modeling protocols in hourly modeling with protocols used in Passive House (PHI and Phius).
- The outcomes required to demonstrate compliance with the standard or certification (i.e., what metric(s) does the code or standard use).
- Discuss differing definitions of floor area, including treated floor area (TFA) used by PHI, interior conditioned floor area (iCFA) used by Phius, and conditioned gross floor area (GFA) commonly used in hourly energy modeling.
- Compare occupancy and lighting assumptions, program assumptions, and other factors that may affect a direct comparison of results from different programs.
- Typical usage and implementation advantages and challenges associated with the standard or certification.
- Analyze and comment on the key differences between PHPP, WUFI Passive, and EnergyPlus modeling programs.
Task 1 will propose a modeling strategy, including potential design strategies, to meet each certification program to be modeled in Task 2.
Task 2 Energy Modeling
Task 2 will compare the results generated using energy model software programs EnergyPlus, PHPP, and WUFI Passive for each standard and climate zone. The following outlines RDH’s workflow for this component of the work:
- For each climate zone, the IECC EnergyPlus model will represent the baseline.
- The basic geometry, assemblies, and systems from the EnergyPlus model will be adapted to develop Passive House compliant models in both PHPP v10 and WUFI Passive v.3.3.02. This will allow for an understanding of the performance requirements to achieve PHI and Phius certification in the prototype building.
- EnergyPlus models will be developed for the various performance standards including PHI, Phuis, and ASHRAE 90.1. The EnergyPlus model results will be compared to understand and assess performance outcomes from the different standards and certification programs.
PHI models will be adjusted to develop a model that is compliant with PHI Classic, Plus, Premium, and Low Energy Building (LEB). Phius models will be adjusted to develop a model that is compliant with PHIUS+ 2021 Core and PHIUS+ 2021 Zero. As this study is focused on new construction, the EnerPHit retrofit standard is outside scope.
For each model, the operational carbon (CO2e/yr) will be reported. We will also present normalised key performance metrics including Energy Use Intensity (EUI), Thermal Energy Demand Intensity (TEDI, heating and cooling), Greenhouse Gas Intensity (GHGI), and other applicable PHI/Phius metrics.
Tasks 3/4/5 Reporting and Presentations
The information from Tasks 1 and 2 will be presented in a draft report for review by PHN and NREL. RDH will incorporate the report content and review feedback into a presentation of preliminary findings.
The draft report will be updated based on the comments provided by PHN and NREL, and any additional feedback garnered through presentation of preliminary findings to represent a Final Report delivered to PHN at the completion of each phase of this work.
3 Modeling Tool Comparison
To provide a comparable study of the energy performance standards in North America, it is important to understand the tools that are used to comply with these standards.
This section summarizes key differences between different the modeling protocols and software tools, including a comparison of EnergyPlus, WUFI Passive, and PHPP as they apply to multifamily residential archetypes. Key considerations for modeling buildings for different Passive House certifications (PHI, Phius) and for using multiple tools for compliance are also provided.
3.1 Previous Studies
Differences between energy performance results using different modeling tools and protocols has been recognized in recent years. There have been studies to assess key differences, although not comprehensively and not yet in the context of Passive House standards in North America. Below are summaries of previous studies that considered different modeling tools. Our study builds on this previous work by exploring how the tools/protocols may be aligned and considering applicability to Passive House standards.
3.1.1 NYSERDA Report
In 2016, The New York State Energy Research and Development Authority (NYSERDA) commissioned a study to evaluate the equivalency and translational capacity of Phius, PHI, and ASHRAE 90.1 Appendix G energy standards16. The goal was to allow a variety of rating systems to qualify building projects for incentives under the NYSERDA Multifamily New Construction Program (MF NCP). The report found significant differences between the modeling protocols for the three programs, which resulted in a discrepancy of nearly two-fold when comparing the baseline building using ASHRAE 90.1 (modeled in eQuest) versus Passive House (using the protocols of the PHI and modeled in PHPP). The baseline used the prescriptive requirements of ASHRAE Standard 90.1-2010 and 90.1-2010 Appendix G Baseline Design. Nevertheless, the study still moved forward with an energy analysis and comparison of the three programs and stated an approximate 30% energy improvement by certifying through PHI or Phius compared to the ASHRAE 90.1-2010 baseline.
The 30% energy improvement reported in the NYSERDA study is significantly lower than the expected 50-60% improvement of Passive House buildings compared to typical new construction that meets most North American building codes17. This raises questions of the validity of comparing energy efficiency standards that use different modeling tools and protocols. The NYSERDA study also only considered energy conservation measures “commonly seen on projects certified through each program” as opposed to a whole-building approach that would be needed to compare the energy consumption across multiple programs and standards. For example, the study modeled design features typical of passive design such as UIMP-0.14 windows, but did not take into account every characteristic of the building that makes it a Passive House such as optimizing shading and thermal bridging, which is modeled in detail using the certification protocols of PHI and Phius (using the PHPP and WUFI Passive modeling tools respectively) but not as rigorously applied in modeling protocols such as ASHRAE 90.1 Appendix G.
3.1.2 PHN Report – Grid Benefits of Passive Houses, Phase 2
In 2023, PHN commissioned a PHI-accredited practitioner to review the results of the report Grid Benefits of Passive Houses, Phase II written for the California Public Utilities Commission (CPUC)18. The goal was to validate the PHI results presented in this report. The original report contained energy performance results of three different one-storey single family homes in three different climate zones. The results were compared with the PHI and California Title 24, Part 6 (T24) standards.
The PHN follow-up study used PHPP to calculate Passive House results whereas the original study used the EnergyPlus hourly modeling tool only to provide Title 24, PHI and Phius results. Results were significantly different, due to the differences in modelling protocols, but also differences in assumed inputs between the original study and the PHN follow-up study to work with PHI-compliant energy models. Examples of differences between the two studies include the need to improve the slab insulation (changed from none to R5) and ventilation heat recovery performance (changed from 70 to 75%) for the single family house in San Jose. The PHN follow-up study highlights that using hourly modeling to assess Passive House compliance can lead to unclear and non-Passive House compliant input assumptions, which make comparisons difficult and inaccurate.
The study also showed that the reduction in energy use for all three houses was more significant when calculated with PHPP. A key takeaway from the study was that there were significant differences in modeled energy performance when different tools were used, e.g. EnergyPlus and PHPP, and that comparing Passive House standards to other building compliance paths should not solely be done in non-Passive House modelling engines to allow the full capture of Passive House design benefits within this comparison.
3.2 Key Differences
Modeling performed for various programs, including Passive House (PHPP), WUFI Passive House (WUFI PH), and hourly modeling projects, differ in two primary ways. First, different software programs use different algorithms to estimate heating/cooling loads and energy use, which leads to differences in the overall results even when identical inputs are used. Second, different programs reference different modeling protocols with standard inputs and assumptions. Each of these differences needs to be considered when comparing results across various modeling tools and programs. These key differences are discussed further in the following sections.
3.2.1 Differences in Algorithms
A key difference between PHPP, WUFI PH and hourly modeling software programs are the algorithms used to estimate heating/cooling loads and building energy use. ASHRAE Fundamentals 2017 (Chapter 19) summarizes various building energy estimation and modeling methods that can be used to estimate annual heating and cooling loads and energy use. Each method varies in accuracy and computational intensity.
The three tools discussed in this report use three distinctly different energy estimation methods.
- PHPP: The PHPP tool uses a monthly degree day calculation to estimate heating and cooling loads. The heating/cooling load is calculated based on enclosure and ventilation losses/gains and internal gains. Monthly heating or cooling degree day values for the location are used to estimate heating/cooling needs based on the calculated loads. Various factors are applied to account for thermal mass, solar and internal heat gain utilization, etc.
- WUFI PH: WUFI Passive also uses a monthly degree day calculation to estimate heating and cooling loads, similar to the PHPP tool. WUFI Passive is built off WUFI Plus which is a dynamic moisture modeling tool19, which allows for the dynamic assessment of the hygrothermal behavior of buildings and components, if required.
- Hourly Tools: There are many different hourly energy modeling tools (e.g. EnergyPlus, DOE2, IESVE, etc.) that use a variety of algorithms. These programs calculate heating/cooling loads and energy use at every hour of the year (8760 hours), or sometimes at sub-hourly time steps. These tools allow for greater precision and detail than degree day and bin method calculations as they account for coincident loads at every hour. For example, where PHPP/WUFI-PH use internal gains averaged over a month or temperature bin, hourly tools use a schedule to account for more granular internal gains at each hour of the day. Hourly tools also better account for the behaviors and impacts of climate, thermal mass, and complex HVAC systems.
Another key difference in the algorithms of these programs is the number of thermal zones that they model. A thermal zone is a space or group of spaces with similar heating/cooling loads. For example, in a multifamily residential building, suites along the South elevation will experience different loads than suites along the North elevation, and so should be separated as distinct zones in a model. PHPP and WUFI Passive are single-zone models, while hourly programs allow the building to be modeled with multiple zones.
Overall, the difference in algorithms between the modeling tools leads to different results, though it is not possible to state generally how results would vary from one building to another. While more complex buildings typically benefit from more detailed models (e.g. hourly models), tools like WUFI Passive and PHPP can be sufficient for some high-performance buildings, and in some ways better for simple buildings like single family homes since they are often faster to model and do not necessarily require a registered professional’s oversight.
3.2.2 Differences in Modeling Protocols
In addition to software algorithm differences, various modeling tools and codes/standards have different modeling protocols or “rules” under which models are developed. These differences can have a significant impact on the results and should be noted when modeled results from various programs and standards are compared.
Table 3.1 summarizes many of the differences between the three types of modeling tool protocols discussed in this report. Though the list is not comprehensive, it provides a sense of the large number of differences that contribute to discrepancies in model results.
It should be noted that PHPP was recently updated to v10 in 2023. Some notable changes in this version are the removal of a specific cooling load criterion and the alternative for a project specific Primary Energy Renewables (PER) target for multifamily buildings.
Table 3.1 Summary of key differences between modeling protocols for residential buildings
| PHPP | WUFI PH20 | Hourly Tools | |
|---|---|---|---|
| General | |||
| Areas | Treated Floor Area (TFA), measured using interior dimensions, excluding partition walls, stairs, open-to-below; applies reduction factors for certain spaces (e.g. mechanical spaces, storage, communication spaces outside of residential dwelling units). | Interior Conditioned Floor Area (iCFA), measured using interior dimensions, including partition walls, stairs, cabinets, mechanical spaces, storage, but excluding open-to-below. | Conditioned Gross Floor Area (GFA), measured using interior dimensions including all areas except open-to-below. |
| Climate | Monthly mean and peak values for typical weather year based on historical data (period unknown) developed using PHI internal process. | Monthly mean and peak values for typical weather year based on historical data (period unknown) developed using PHIUS internal process. | Files vary by software program. Typical weather year based on hourly data compiled from Department of Energy (DOE) protocol. TMY3 data set derived from 1991-2005 National Solar Radiation Data Base update. |
| Lighting, Appliance/Plug Loads, and Internal Gains | |||
| Occupancy | Standard “average” occupancy determined on the basis of typical occupancy densities and number/size of dwelling units. | For residential buildings, 2 people for first bedroom + 1 per additional bedroom. | Varies depending on modeling standard. Typically 2 people for first bedroom + 1 per additional bedroom. |
| Schedules / Hours | Annual operating hours are defined for each end use. Option to choose from standard schedules for non-residential spaces or create custom schedules. | Annual operating hours are defined for each end use. Option to choose from standard schedules for non-residential spaces or create custom schedules. | Hourly schedules consider typical residential profiles for occupancy, lighting, appliance/plug loads for weekdays and weekends; typical schedules available depending on standard. |
| Lighting & Plug Loads |
Estimates are entered for each end use (e.g. each appliance, plus general values for lighting and entertainment).
|
Phius multifamily calculator used to determine estimates for lighting, appliances, entertainment.
|
Standard W/m² values are typically used together with hourly schedules.
|
| Exterior Loads | Most loads outside the thermal envelope are excluded (e.g. lighting, parking garage fans). | Most loads outside the thermal envelope are excluded (e.g. parking garage lighting and fans). | Exterior loads like lighting and parking garage lighting/fans are included (though normalized to the gross conditioned floor area). |
| Elevator Energy | Estimated using PHI elevator energy calculator, mainly relying on typical assumptions for motor energy and usage. | Estimated using PHIUS multifamily calculator based on Energy Star Multifamily New Construction Simulation Guidelines version 1 (rev 1), mainly relying on typical assumptions for elevator type. Assumptions tend to be lower than in PHPP and hourly models. | Typically entered as an additional load; some guidelines provide a standard kW per elevator used in combination with a typical residential schedule. |
| Internal Gains | Value depends on building type (e.g. dwelling versus commercial). Default value used for residential building types, varying based on average dwelling size and occupancy for residential. | Based on occupancy, lighting, and plug loads as modeled. | Based on occupancy, lighting, and plug loads as modeled. Max loads for each source applied to respective profiles. |
| Temperature Set Point / Set Back | Heating: 68°F (20°C) Cooling: 77°F (25°C) |
Heating: 68°F (20°C) Cooling: 77°F (25°C) |
Per building’s mechanical design; standard residential values are: Heating: 72°F (22°C) with night set back to 64°F (18°C) for 6 hours Cooling: 24°C with no set back |
| Domestic Hot Water (DHW) & Drainage | |||
| DHW Demand | Equivalent to 6.6 gal/person/day at 140°F (25 L/person/day at 60°C) Washing machines and dishwashers DHW demand considered additionally. |
Equivalent to 6.6 gal/person/day at 140°F (25 L/person/day at 60°C) Washing machines and dishwashers DHW demand considered additionally |
Typically 0.025 gpm/person (0.0016 L/s/person) peak |
| Schedules | None for residential. Utilization patterns can be defined or selected from standard for non-residential areas. | None for residential. Utilization patterns can be defined or selected from standard for non-residential areas. | Standard hourly schedule based on typical use. |
| Circulation and Distribution Pipe Insulation & Losses | Model includes for losses through pipe length, pipe diameter, levels of insulation and DHW temperature. Detailed pipe length takeoffs required. | Model includes for losses through pipe length, pipe diameter, levels of insulation and DHW temperature. Simplified pipe length calculator available. | Pipe insulation and losses can be modeled, but not typically accounted for. |
| Plumbing Vent Stack And Rainwater Leader Losses | Modeled as a thermal bridge, with impact linked to amount of convection within vented stacks. | Not modeled | Not modeled |
| Building Enclosure | |||
| Infiltration | Tested value used in final model (airtightness testing at 50Pa: ACH50). | Tested value used in final model (air permeability at 50 Pa: cfm50/ft² enclosure or at 75Pa: cfm75/ft² enclosure). | Depends on standard; often default modeling values under normal building operation (not tested) are used. Option to choose between various infiltration models and input methods (e.g. ACH vs enclosure leakage vs flow rate). |
| Enclosure area takeoffs | External surface area (including wall/roof/floor thickness) | External surface area (including wall/roof/floor thickness) | Internal surface area (excluding wall/roof/floor thickness) |
| Thermal Bridging Accounting | Comprehensive thermal modeling required. | Thermal modeling required of key details required, though accounting is less extensive than PHI; typical values accepted for some standard details. | Extent of thermal bridging depends on standard; typically, not considered in as much detail as PHPP/WUFI PH. |
| Window Accounting | Actual window dimensions modeled, including effects of installation; components of the window are broken down and the performance of each part is entered. | Actual window dimensions modeled, including effects of installation; components of the window are broken down and the performance of each part is entered. | Size and window type can be specified; however, window installation is typically not accounted for. Window frame components are not broken down into as much detail as PHPP/WUFI PH. |
| Shading | Interior shades can be included. Exterior shading and overhangs modeled as designed. Horizon shading is modeled. |
Interior shades can be included. Exterior shading and overhangs modeled as designed. Horizon shading is modeled. |
Occupant controlled interior shades not considered. Exterior shading and overhangs modeled as designed. Horizon shading typically not considered. |
| HVAC Systems | |||
| Part Load Performance | Not modeled | Not modeled | Modeled using typical or product specific curves. |
| Fan Efficiency & Pressure | Set fan energy (W/cfm or Wh/m3) entered | Set fan energy (W/cfm or Wh/m3) entered | Typically modeled based on airflow rate, pressure drop, and efficiency |
| HRV Duct Lengths & Insulation | Duct losses between unit and thermal enclosure are modeled | Duct losses between unit and thermal enclosure are modeled | Duct losses between unit and thermal enclosure not accounted for |
| Heating/Cooling Systems | Efficiency entered, sometimes at multiple test points to calculate annual efficiency. Outside calculations required for more complex systems. | Efficiency entered, sometimes at multiple test points to calculate annual efficiency. Outside calculations required for more complex systems. | Depends on software and system; more advanced software tools can directly model complex HVAC systems. |
3.3 Summary
There have not been many comprehensive studies of the differences in modeling tools and protocols in North America. The NYSERDA study found significant differences in modeling results depending on the tool and protocol for the different energy standards. A previous PHN report and report review on Grid Benefits of Passive House for CPUC had similar findings – different tools (EnergyPlus or PHPP) and modeling protocols yield notably different results.
A high level overview of key differences between PHPP, WUFI Passive, and hourly modeling (EnergyPlus, eQuest, and many more) was presented. These differences are from the modeling algorithms themselves, how the tools calculate the results based on project data, and the protocols for how such data is interpreted and used in the modeling process.
4 Proposed Modeling Parameters
4.1 Geographic Locations
There are 8 primary climate zones in North America as defined by IECC. These are further divided into subcategories A (moist), B (dry), and C (marine), though not every variation currently exists in the US (Figure 4.1). This study will focus on climate zones 1 through 7. Climate zone 8 is limited to northern Alaska, where the 4-story multifamily residential archetype selected for this study are not typical. Climate zone 8 was thus excluded from this study.
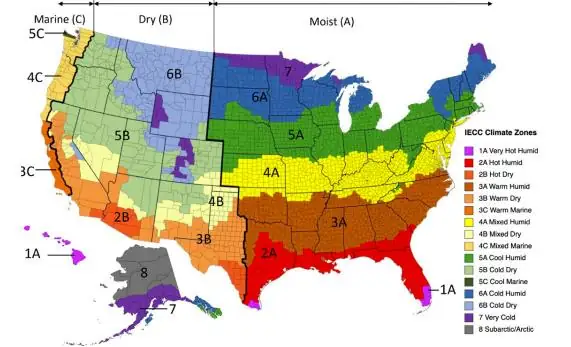
In order to produce results for a wide variety of climate zones and locations, EnergyPlus models will be batch run for a variety of cities across the United States. To determine the building characteristics (i.e. assemblies and systems) that achieve the various Passive House performance standards, one location will be selected for each climate zone. Locations for PHPP and WUFI-PH modeling were selected by considering the highest number of heating and/or cooling degree days, and latent cooling loads in cooling-dominated climates. Selected locations were then adjusted based on discussions with PHN to prioritize locations with larger population centres and Passive House activity.
Table 4.1 shows the cities that we propose to model in PHPP and WUFI-PH selected based on the above criteria to determine design characteristics capable of meeting each standard.
Table 4.1 Locations proposed for energy modeling
| Climate Zone | Proposed Representative City for PHPP and WUFI-PH | Cities for Full EnergyPlus Modeling |
|---|---|---|
| 1 | Miami, FL (1A) | Honolulu, HI (1A) |
| 2 | Houston, TX (2A) | Austin, TX (2A) Tampa, FL (2A) Tucson, AZ (2B) |
| 3 | Atlanta, GA (3A) | El Paso, TX (3B) Memphis, TN (3A) |
| 4 | Philadelphia, PA (4A) | Albuquerque, NM (4B) Baltimore, MD (4A) New York, NY (4A) Pittsburgh, PA (4A) Seattle, WA (4C) |
| 5 | Chicago, IL (5A) | Boston, MA (5A) Bozeman, MT () Buffalo, NY (5A) Denver, CO (5B) Port Angeles, WA (5C) |
| 6 | Minneapolis, MN (6A) | Bozeman, MT (6B) Burlington, VT (6A) Portland, ME (6A) Rochester, MN (6A) |
| 7 | Duluth, MN (7) | Aspen, CO (7) International Falls, MN (7) |
4.2 Electricity Emissions Factors
GHG emissions factors are multipliers to the calculated operational energy which determine the equivalent carbon emissions in kilograms of CO2 per unit of energy consumed. The 2022 Cambium dataset21, published by NREL released January 2023, was sourced for long run marginal emission rates for grid electricity. A long-run marginal emission rate is the rate of emissions that would be either induced or avoided by a long-term change in electrical demand. These rates are published by Generation and Emissions Assessment (GEA) regions, which are similar to the US EPA eGRID regions, and alternatively by US state. Note that the Cambium data set considers the 48 contiguous states and thus excludes Alaska and Hawaii.
Long-run emission rates are used because they account for how design changes could affect both the operation and structure of the grid. This is helpful for estimating the impacts of long-term interventions. Conversely, short-run marginal data consider grid assets as fixed.
The Cambium dataset allows for the calculation of levelized emissions values under several different scenarios. For this study, we have selected default parameters including the combustion emissions stage, an evaluation period (timeline of the intervention study) of 20 years, mid-case scenario and intervention located at the end-use. The mid-case scenario is the middle of 10 provided scenarios by degree of decarbonization progress, costs of renewables, natural gas, and batteries, among other factors.
Table 4.2 shows examples of the levelized long-run annual marginal emission rates for select cities. The Cambium dataset does not present national average values; we have calculated overall averages for the GEA and state-by-state data, however note that these are not weighted by generation capacity.
Table 4.2 Example emission factors
| IECC Climate Zone | City | GEA Region | State | Annual long-run marginal emission rate by GEA (kgCO2/MWh) | Annual long-run marginal emission rate by state (kgCO2/MWh) |
|---|---|---|---|---|---|
| 2B | Tucson | AZNMc | Arizona | 137.9 | 150.3 |
| 3A | Atlanta | SRSOc | Georgia | 305.1 | 304.7 |
| 4A | Philadelphia | RFCEc | Pennsylvania | 280.2 | 324.9 |
| 4C | Seattle | NWPPc | Washington | 102.9 | 46.9 |
| 5A | Chicago | RFCWc | Illinois | 311.1 | 240.0 |
| 6A | Minneapolis | MROWc | Minnesota | 134.6 | 123.9 |
| 7 | Aspen | RMPAc | Colorado | 162.6 | 155.2 |
| GEA Average (all 20 GEA regions, simple average) | 197.0 | ||||
| State-by-state Average (all lower 48 states, simple average) | 205.8 | ||||
An equivalent national value for levelized long-run annual marginal emission rate was calculated manually using available Cambium 2022 data and following the method described in the 2022 documentation22. The manually calculated national value was 245.5 kgCO2/MWh, which is higher than either simple average presented previously.
As a point of reference, the PHIUS+ 2018 certification used an average electricity emissions factor of 680 kgCO₂/MWh based on past generation and consumption data from the Energy Information Administration (EIA). PHIUS has since shifted to a source energy factor for grid electricity that reflects future projections based on modeling by NREL.23
We propose to use the annual long-run marginal emission rate by state for the GHG emissions analysis.
4.3 Archetype Building Characteristics
We propose to begin the archetype model development using the EnergyPlus prototype files developed by Pacific Northwest National Laboratory (PNNL) and available online for IECC 2012, 2015, 2018, 2021 and ASHRAE 90.1-2013, 2016, 201924. Table 4.3 summarizes general characteristics of the baseline model. These characteristics are shown as a starting point for discussion and to inform the modeling process; scenarios will be updated during the energy modeling task to confirm compliance with all requirements. Please note that this is not intended to be a comprehensive list of modeling inputs and assumptions; a more detailed table of inputs and assumptions will be developed following general alignment on key characteristics.
Table 4.3 Summary of archetype key characteristics
| IECC | ASHRAE 90.1 | PHI | PHIUS | |
|---|---|---|---|---|
| Number of Stories | 4 | 4 | 4 | 4 |
| Floor Area, ft² | 33,700 | 33,700 | TFA TBD | iCFA TBD |
| Number of units | 31 | 31 | 31 | 31 |
| Building Enclosure | ||||
| VFAR25 | 0.49 | 0.49 | 0.49 | 0.49 |
| Above Grade Walls | Wood-frame walls with insulation as required by climate zone Effective R-values ~14-18 |
Wood-frame walls with insulation as required by climate zone Effective R-values ~10-18 |
Wood-frame walls with exterior insulation as required Effective R-values ~15-40 |
Wood-frame walls with exterior insulation as required Effective R-values ~15-40 |
| Windows | Vinyl frame with double glazing Fixed U-values ~0.45-0.29 SHGC 0.25-0.4 |
Vinyl frame with double glazing Fixed U-values ~0.45-0.29 SHGC 0.25-0.4 |
Vinyl frame with double or triple glazing Fixed U-values ~0.3-0.15 SHGC ~0.2-0.4 |
Vinyl frame with double or triple glazing Fixed U-values ~0.3-0.15 SHGC ~0.2-0.4 |
| Roof | Low slope roof with insulation above deck as required Effective R-values ~25-35 |
Low slope roof with insulation above deck as required Effective R-value ~25-35 |
Low slope roof with insulation above deck as required Effective R-values ~30-60 |
Low slope roof with insulation above deck as required Effective R-values ~30-60 |
| Airtightness | 0.20 cfm/sf of above grade wall area at operating pressure | 1.0 cfm75/sf | 0.6 ACH50 | 0.06 cfm50/sf or 0.08 cfm75/sf |
| Thermal Bridging | Not considered (inc. IECC-2021) | Not considered (inc. ASHRAE 90.1-2019) | Standard allowance to be included | Standard allowance to be included |
| Mechanical | ||||
| Heating | Gas furnace Efficiency 80% |
CZ 1-3: Direct electric CZ 4-7: Gas boiler, efficiency 80% |
Central heat pump with in-suite FCUs; gas top-up CZ7 COP ~2-3 |
Central heat pump with in-suite FCUs; gas top-up CZ7 COP ~2-3 |
| Cooling | Local split system DX (1 per unit) | Local PTAC, EER 12 | Central heat pump COP ~3.2 |
Central heat pump COP ~3.2 |
| Ventilation | Constant volume, rates per ASHRAE 62.1 No heat recovery |
Constant volume, rates per ASHRAE 62.1 No heat recovery |
Variable volume, peak per ASHRAE 62.1, standard per PHI Heat recovery >80% SRE |
Variable volume, peak per ASHRAE 62.1, standard per PHIUS Heat recovery >80% SRE |
| Domestic Hot Water (DHW) | Central gas storage water heater Efficiency ~80% |
Central gas storage water heater Efficiency ~80% |
Central heat pump water heater; gas top-up CZ7 COP ~2-3 (varies by climate zone) |
Central heat pump water heater; gas top-up CZ7 COP ~2-3 (varies by climate zone) |
| Internal Loads & Schedules | ||||
| Lighting | Suite: 1.34 W/ft² Corridor: 0.55 W/ ft² Standard schedules |
Suite: 1.34 W/ft² Corridor: 0.55 W/ ft² Standard schedules |
Standard PHI values for suites; 25% below ASHRAE 90.1 for common areas | Standard PHIUS values for suites; 25% below ASHRAE 90.1 for common areas |
| Plug Loads | 0.62 W/ft² peak with schedule | 0.62 W/ft² peak with schedule | Standard PHI values | Standard PHIUS values |
| Occupancy | 94 people total | 94 people total | TBD (Standard assumption) | TBD (Standard assumption) |
| Miscellaneous | 1 elevator | 1 elevator | 1 elevator | 1 elevator |
4.4 Model Iterations
This study includes a significant number of codes, standards, and certification programs to be assessed using three different energy modelling tools (EnergyPlus, PHPP, and WUFI Passive). To clarify the specific standard versions and model iterations that will be simulated, Table 4.4 summarizes the iterations that will be performed. Each cell represents a single model iteration. Rows that have a standard included in several columns show where the same scenario will be modeled across different software programs for comparison purposes.
Table 4.4 Summary of model iterations
| EnergyPlus | PHPP | WUFI PH | |
|---|---|---|---|
| Codes & Standards | |||
| IECC 2012 | |||
| IECC 2015 | |||
| IECC 2018 | |||
| IECC 2021 | |||
| IECC 2021 Adjusted* | |||
| ASHRAE 90.1-2013 | |||
| ASHRAE 90.1-2016 | |||
| ASHRAE 90.1-2019** | |||
| ZERH*** | |||
| PHI Programs | |||
| Passive House Classic | Passive House Classic | ||
| Passive House Plus | Passive House Plus | ||
| Passive House Premium | Passive House Premium | ||
| Passive House LEB | Passive House LEB | ||
| PHIUS Programs | |||
| Phius+ 2021 Core | Phius+ 2021 Core | ||
| Phius+ 2021 Zero | Phius+ 2021 Zero | ||
*Adjustments proposed for airtightness and thermal bridging to reflect typical building performance
**Use to assess LEED points vs 2016 reference
***>20% below ASHRAE 90.1-2019 energy or cost
Notes
- Multifamily New Construction Program (PON 3716): NYSERDA, https://portal.nyserda.ny.gov/servlet/servlet.FileDownload?file=00Pt000000C5dRoEA
- Ely, T. (2017): Comparison Study of Passive Houses using ERS, Prepared by City Green Solutions for Natural Resources Canada.
- Frappé-Sénéclauze, T., Heerema, D., and Tam Wu, K. (2016): Accelerating Market Transformation for High-Performance Building Enclosures; Pembina Institute report
- Heating demand is the annual heating demand for space conditioning within the Passive House enclosure.
- Heating Load is the maximum heating energy required by the building for space heating and conditioning of ventilation air calculated for a cold, clear day and a moderate overcast day.
- Cooling demand is the annual cooling demand for space conditioning within the Passive House enclosure.
- Primary Energy Renewable is the total annual energy use on site, includes multipliers on energy use based on the energy source and potential for simultaneous renewable production. Evaluates the building in an assumed future where all sources of energy are from 100% renewable sources.
- Primary Energy is the annual energy use of the building measured at the energy generation site.
- Certified Buildings Map: Passive House Institute, https://database.passivehouse.com/buildings/map/, [accessed August 2023].
- Phius Certification Guidebook v3.2 https://www.phius.org/sites/default/files/2023-07/Phius%20Certification%20Guidebook%20v3.2.pdf, [accessed July 2023].
- Phius About Us https://www.phius.org/about-us, [accessed July 2023].
- PREFACE 2021 International Energy Conservation Code (IECC) https://codes.iccsafe.org/content/IECC2021P2/preface, [accessed July 2023].
- Who We Are – ICC https://codes.iccsafe.org/content/IECC2021P2/preface, [accessed July 2023].
- About ASHRAE https://www.ashrae.org/about, [accessed July 2023]..
- USGBC. LEED v4.1 Building Design and Construction. July 2023. Available online: https://build.usgbc.org/bd+c_guide
- Karpman, M. and Beaulieu, S. (2017): ASHRAE 90.1 Appendix G / PHIUS+ / Passivhaus Comparison Evaluation for Multifamily Buildings; Prepared for New York State Energy Research and Development Authority, NYSERDA Report 17-19.
- PNNL Reference Code Minimum for MURBs in British Columbia is 135 kWh/m². Passive House energy demand limit is 60 kWh/m², which may be <56% reduction depending on fuel mix.
- A Review of the report Grid Benefits of Passive House, Phase II. July 2023. Available online: A Review of the report Grid Benefits of Passive Houses, Phase II (PDF)
- WUFI Passive. July 2023. Available online: https://wufi.de/en/software/wufi-passive/
- Phius 2021 Passive Building Standard Certification Guidebook Version 3.2. July 2023. Available online: https://www.phius.org/sites/default/files/2023-07/Phius%20Certification%20Guidebook%20v3.2.pdf
WUFI Passive Manual. July 2017. Available online: https://wufi.de/de/wp-content/uploads/sites/9/2017.07_WUFI-Passive-Manual_en.pdf - Gagnon, Pieter; Cowiestoll, Brady; Schwarz, Marty (2023): Long-run Marginal Emission Rates for Electricity – Workbooks for 2022 Cambium Data. National Renewable Energy Laboratory, Golden, CO. 10.7799/1909373. https://data.nrel.gov/submissions/206
- Cambium 2022 Scenario Descriptions and Documentation. Available online: https://www.nrel.gov/docs/fy23osti/84916.pdf
- PHIUS Certification Guidebook. Available online: https://www.phius.org/sites/default/files/2022-03/Phius%20Certification%20Guidebook%20v3.02.pdf
- https://www.energycodes.gov/prototype-building-models#Commercial
- Vertical Enclosure to Floor Area Ratio