An investigation into policies driving Passive House adoption in North America.
A Passive House Network Report · By Bronwyn Barry, PHN’s Policy Lead · June 2022 (v1.1) · Download the PDF · All reports
Published in 2022; figures and programs are as of then. Current codes and incentives: Building Codes and Building Financial Incentives.
On this page: Abstract · Introduction · Benchmarking Passive House Programs and Policies · Cross-Referencing Success · Connecting Realized Projects to Policies and Programs · Identifying Patterns · The Invisible Hand · Up and Coming Regions · Baseline Code & Passive House Intersection: An Apples and Oranges Story · Conclusions on Quilting Policies · Summary · Notes · Acknowledgements · References
Abstract
There are currently eighty-six (86) multifamily buildings pursuing Passive House certification in Massachusetts. How did this happen so quickly, and what were the policy drivers responsible for this remarkable escalation?
To further understand the policy structures and mechanisms driving Passive House adoption, not only in Massachusetts but elsewhere across North America, the Passive House Network (PHN, formerly NAPHN) embarked upon a comprehensive study to identify what, where and how Passive House policies were being implemented across North America. Not only did we want to understand the drivers behind these policies, but we wanted to determine which policies were more successful and why. We began by inventorying and benchmarking all existing Passive-House-focused, or Passive House-related policies, using Certified Passive House projects as our yardstick. Using that metric, we found three front-runner regions and then reviewed specific policies operating in those regions to look into how they were structured and what key patterns or mechanisms they shared, if any.
We’ve described our journey of discovery here.
Introduction
In early 2019 there was growing optimism and excitement around two policy efforts in California centered on Passive House-specific alternate compliance pathways. These were being vetted and explored via California’s utility-sponsored Codes and Standards team. By the close of 2019, neither of these proposals were selected to move forward due to a perceived lack of interest and an inability to reconcile Passive House model outputs with California’s compliance recording database. These failed attempts at developing and implementing Passive House policies (in direct contrast to the success in Massachusetts) provided the impetus for this investigation. We wanted to better understand which policies were working elsewhere, why, and how to successfully replicate them.
Benchmarking Passive House Programs and Policies
Our first task was to develop a roadmap and create a plan. We started by inventorying existing policies by convening a round table in November 2020, inviting chapter members and representatives of allied organizations to contribute details of existing codes, policies, or incentive programs either directly or indirectly incentivizing Passive House in their region. This uncovered a remarkable array of incentives already in place. We cataloged them and analyzed them according to:
- where they intersected with the building development process, and
- what mechanisms they utilized. (i.e. did they operate within a baseline code structure, or outside baseline code; were they an incentive, penalty, or other?)

Cross-Referencing Success
As our ‘Mapping Drivers of Passive House’ (Figure 1) graphic shows, we identified a broad range of policies operating both within and beyond the boundaries of mandated code structures. In order to determine which of these were functionally most successful, we looked for where the largest number of realized projects existed. We collected this data from two publicly available databases and defined our measure of success using two key metrics:
In order to identify which policies were responsible for successful implementation, we disaggregated our data by geographic region. To maintain our focus on policy drivers and not bias policymakers towards one certification or another we purposely obscured the differences between the two certification options currently available in North America. We found both pathways almost interchangeably accepted.
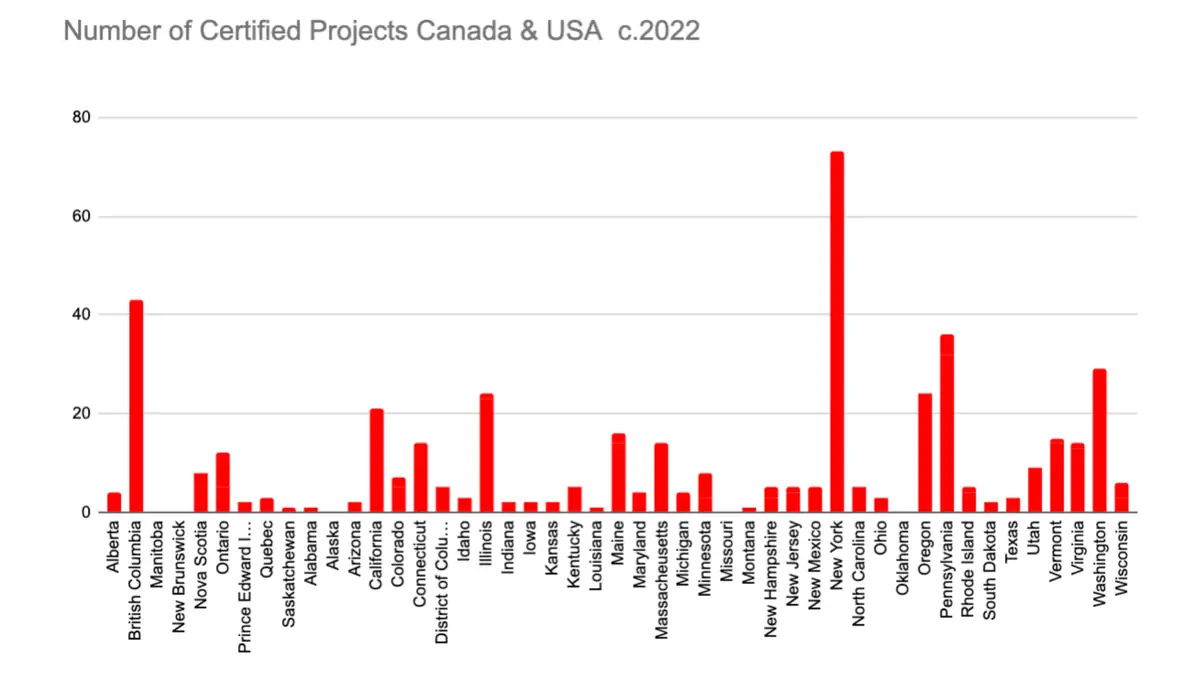
Initially looking at unit numbers of certified projects, we found a relatively even spread of projects across The United States and Canada, with New York and British Columbia reporting significantly higher numbers of certified projects than all other regions. However, using unit numbers alone prevented us from being able to distinguish between larger, multifamily buildings – all counted as single units – and a relatively large number of single-family homes. For this reason, we needed a second set of data points showing total treated floor area3 (TFA) in square feet, which we plotted across the same geographic regions.
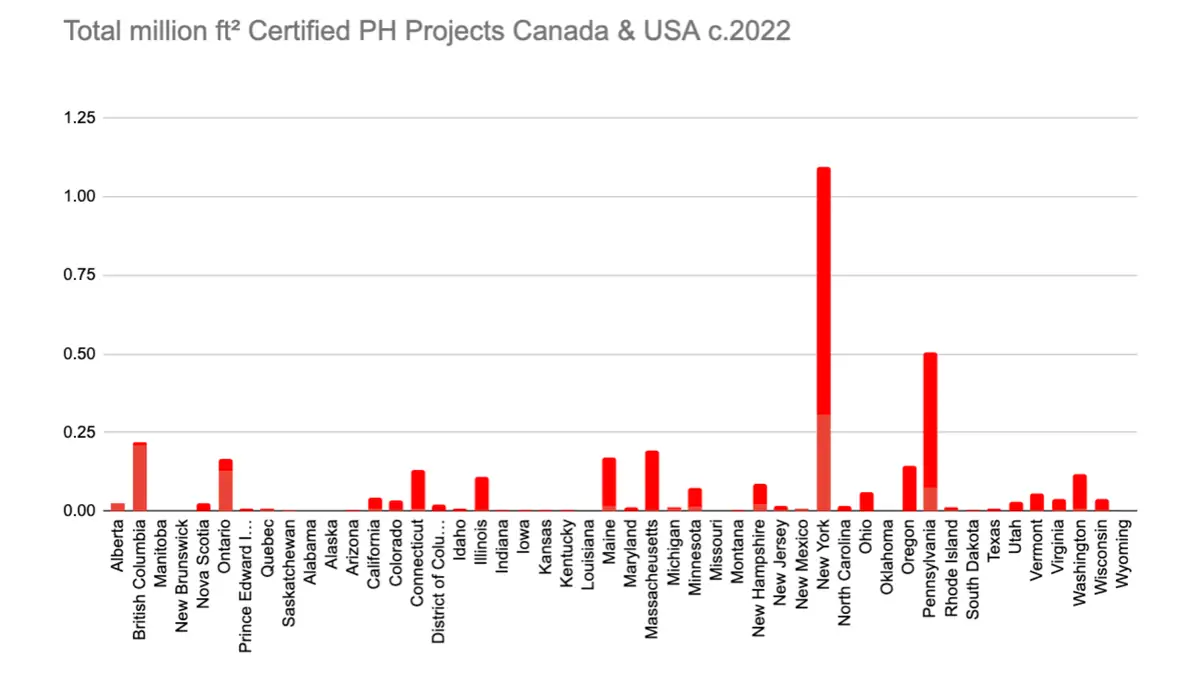
Cumulatively, the projects represented by this graph cover a total of 3.5 million square feet (using TFA) of Certified Passive House projects across North America. This more granular view using total square feet of certified projects allowed us to more clearly identify which regions were building the larger projects most likely to transform a marketplace. Using both metrics, three particular regions emerged as the front-runners:
- New York
- Pennsylvania
- British Columbia
with Massachusetts, Ontario, and Maine following closely behind in total square footage.
In addition to these publicly visible results, we know from working directly with clients and developers, that a significant number of owners choose not to publish their project information. To account for these invisible projects, we reached out to the Passive House Institute (PHI) to share current internal data of all their Certified Passive House buildings located across Canada and the United States.
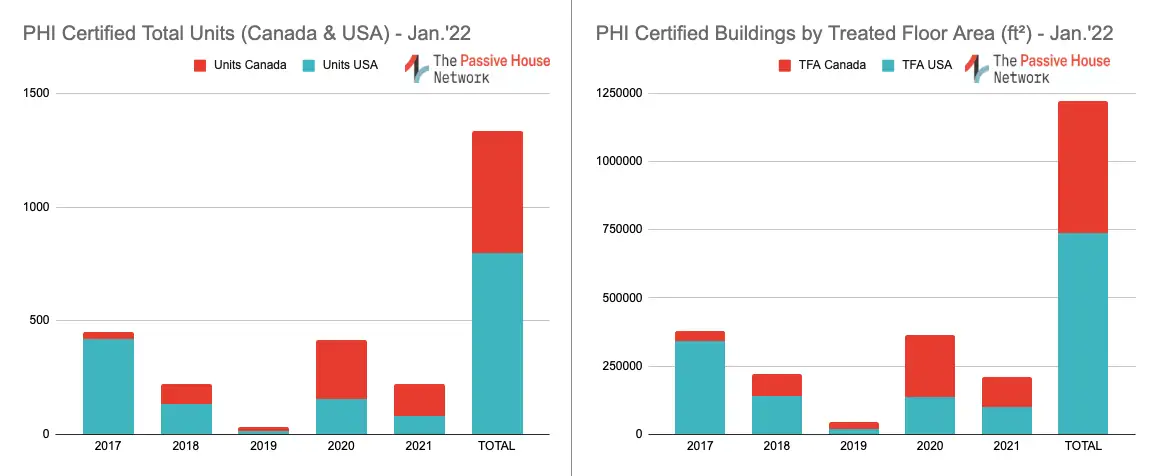
In order to account for the unpublished PHI-certified projects, we deducted the total area of published projects from their cumulatively certified totals. This revealed an additional 359 thousand square feet of PHI Certified Passive House projects, bringing the combined number of Certified Passive House projects in North America, as of January 2022, to just under four million square feet.
Table 1. Total area Certified Passive House projects c. Jan.’22
| Total certified projects (TFA) ft² | |
|---|---|
| PHIUS (published) | 2,644,900 |
| PHI (published) | 862,271 |
| PHI (unpublished) | 359,603 |
| Total | 3,866,774 |
Connecting Realized Projects to Policies and Programs
We then cross-referenced the locations of significant areas of certified Passive House projects against the Passive-House-specific codes or policies we had benchmarked4. Given the three front-runner regions clearly identified in Figure 3, we chose to pay closer attention to the specific policies in place in New York, Pennsylvania and British Columbia.
Identifying Patterns
We had already mapped the key programs in place across all regions (see Figure 1.) and then retroactively identified the programs in place in our front-runner regions by outlining them in red. A series of patterns emerged:
-
City-led directives with clear, ambitious targets: Two major cities, New York City and Vancouver, led early on with reports defining ambitious and visionary directions for their built environments. In 2014, by including a Passive House case study in its ‘One City Built to Last’ (One City 2014), New York City’s leadership sent a clear signal as to where this city was heading. A similar 2014 Vancouver report announced support for alternate certifications and pathways to green buildings. This cleared a path for their 2016 Zero Emissions Green Building Plan (City of Vancouver 2016), which more specifically detailed where they were heading.
Curiously, both Vancouver and New York City initially required city-owned buildings to meet LEED Gold standards. Neither mentioned nor mandated Passive House certification, yet both tacitly acknowledged Passive House via the inclusion of readily identifiable Passive House target metrics.5 Vancouver soon revised their targets in an updated 2016 Zero Emissions plan and clearly directed staff to:
“build all new City-owned and Vancouver Affordable Housing Agency (VAHA) projects to be Certified to the Passive House standard or alternate zero-emission building standard, and use only low carbon fuel sources, in lieu of certifying to LEED Gold unless it is deemed unviable by Real Estate and Facilities Management, or VAHA respectively, in collaboration with Sustainability and report back with recommendations for a Zero Emissions Policy for New Buildings for all City-owned and VAHA building projects by 2018.”(City of Vancouver 2016)
The City of Pittsburgh followed this pattern. In 2019, they issued a formal press release stating:
“Mayor William Peduto’s administration would require all new or renovated City government buildings to be net-zero, meaning they are so efficient that they produce as much energy as they consume.” (City of Pittsburgh 2019)
-
State-led workforce training and development subsidies: Again, both New York and British Columbia supported and encouraged early adopters via subsidies for Passive House professional trainings. From 2014-2016, NYSERDA provided $500 per person to directly offset tuition costs payable towards a Certified Passive House Designer or Consultant (CPHD/C) training or Passive House-specialty course. (NAPHN Policy Resource Guide, 2019.) Once funding for front-runner training was exhausted, a critical mass of Passive House-qualified professionals had been established. This generated a ‘fly-wheel’ effect whereby the rest of the market become induced to take training.
Similarly, the province of British Columbia provided training subsidies via their WorkBC and BCIT programs. The BC training subsidies remain in place and have been scaled and replicated across Canada to other regions.6 Curiously, in Pennsylvania, only a handful of professionals received a training subsidy. This subsidy was directed specifically at a small cohort of already-qualified professionals, who received support for training to become Passive House Trainers.
To further establish a correlation between significant numbers of qualified Passive House professionals and implementation success, we returned to data we had captured in our 2019 Policy Resource Guide. We restructured this data to graphically align with our newly collected data sets. Unsurprisingly we found a direct correlation between the number of certified Passive House professionals and the existence of certified projects in the same region.
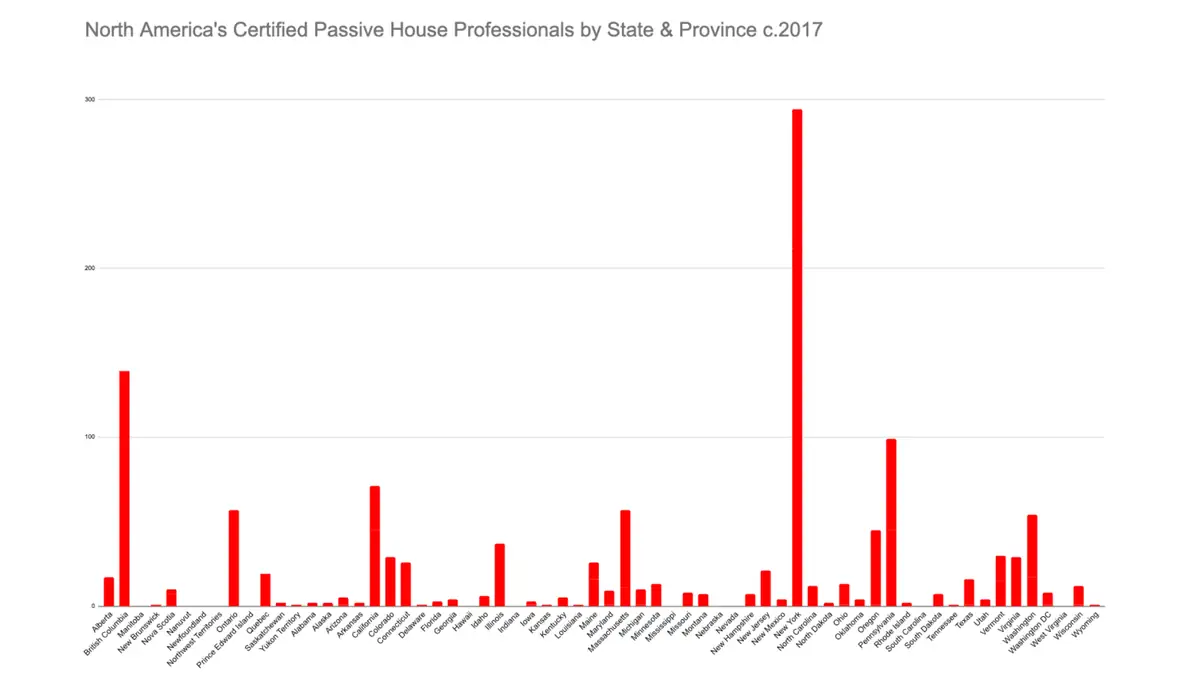
Figure 5. North America’s Certified Passive House Professionals by Region c. 2017.[4] Source: NAPHN Policy Resource Guide, 2019. Data provided to PHN by Brandon Nicholson Again, the notable lead by New York, followed by British Columbia, and trailed closely by Pennsylvania, indicates a strong correlation with clear-sighted policies (and funding support) laid down in these three regions. It confirmed that project growth is not simply a happy coincidence due to the enthusiasm of these region’s professionals. Conversely, a respectable number of qualified professionals located in California has not yet translated into the significant square footage of certified projects. This could indicate that our two data sets are tenuously connected, but more likely confirms that certified projects in California remain largely confined to the single-family home typology. (The public databases confirm the latter.)
-
Financial Subsidies for Front-Runner Projects: The final policy pattern we identified across the three front-runner regions was the existence of some form of financial incentive or assistance program to lower the initial barriers to adoption by front-runners. This pattern has taken slightly different forms in each region.
After early successes with projects in New York City, the State of New York’s NYSERDA entity rolled out a comprehensive design competition in the form of their ‘Buildings of Excellence’7 program. This $40 million program is scheduled to run for three years. It offers applicants up to one million dollars in assistance, starting with support for early design modeling. The competition requires teams to submit detailed energy modeling, costs and performance reports, providing NYSERDA with a feed-back loop for use in future subsidy programs. This data offers clear insight into the most effective strategies deployed and provides a wealth of data for use in the state’s baseline- and reach code updates.
In Pennsylvania, their funding mechanism manifested in a bold experiment by their State-run Low-Income Housing Tax Incentive (LIHTC) program. In 2015, following advocacy from a small group of local stakeholders, the state tax subsidy program managed by the Pennsylvania Housing Finance Authority (PHFA) experimentally included ten bonus Qualified Allocation Process (QAP) points for projects seeking Passive House certification. By 2018 this experiment had transformed this program into a remarkable success story. Results showed construction costs for Passive House buildings dropped from an initial average of 5.8% higher than similar code-compliant projects, to 3.3% lower within three short years. Despite an attempt to replicate this success by other state LIHTC programs, no other state has experienced quite the same success. When PHN charged Zack Semke with investigating this for our 2019 Policy Resource Guide, he found that PHFA’s program included three key mechanisms that had not been replicated in other incentive programs, these being:
- The LIHTC process must be competitive
- Passive House points must be significant
- Passive House must not be lumped together with ‘easier’ green certifications. (NAPHN 2019)
In British Columbia, subsidies for front-runner projects have been delivered in a series of smaller, more piecemeal incentives, primarily driven by the City of Vancouver. A comprehensive set of incentives,8 including preferential re-zoning, density and height bonuses, and lot line relaxations for retrofits, combined with dedicated and expedited permitting have all translated into financial value for early adopters. However, a unique provincially-funded program to scale Passive-House-specific products could be interpreted as an indirect project subsidy. In 2017 the B.C. government-funded a tiered incentive program to local window manufacturers to assist with the design and production of Certified Passive House windows. The program supported seven B.C. manufacturers in developing six Passive House and six Energy Star Most Efficient new window systems. By making these specific products – which are usually a cost premium in Passive House – locally available, the province indirectly lowered costs for higher performance while simultaneously supporting local industry. This innovative incentive approach has yet to be replicated elsewhere. However, this tiered structure, with ‘Passive House Certified’ at the top step, is a pattern we identified working in multiple policies driving Passive House implantation – notably, the BC Energy Step Code and the Marshall Fire Rebuild incentive program in Colorado.9
When we reviewed the common features in place across all three front-runner regions, we noted similar patterns in many other regions. For example, Washington State boasts a respectable number of projects (Figure 1.) However, these have not yet translated into a significant total square footage of certified projects (Figure 1), despite the existence of an alternate compliance code pathway for certified residential projects. (Washington State 2018.) Similarly, in Oregon, Illinois, and California, project numbers and numbers of trained professionals are similar, but Figure 3 shows that their project sizes have not scaled beyond single-family residential projects. This indicates that all three patterns must be in place for successful policy outcomes. This tri-factor finding was the strongest pattern we identified. It replicates the same pattern successfully deployed by the Brussels Ministry of the Environment’s 2017 ‘Exemplary Buildings Challenge’ program, which transformed their building industry from worst in Europe to best in seven years, using this same formula. (Building Innovations Database 2011) Similar findings were confirmed in another report for California’s Public Utilities Commission. (Joyce and Wilhelm 2022.)
The Invisible Hand
Not visible in the above three policy patterns, but essential to their success, is the existence of local Passive House practitioner- and advocacy communities in all three regions. New York policymakers have enjoyed the benefit of an active 501c3 non-profit group in New York Passive House (NYPH.) Their efforts have built an active community of practitioners in that region. NYPH has been both willing and able to provide the advocacy and technical support needed to move policy efforts forward. Similar organizations exist in both British Columbia and Pennsylvania, where Passive House Canada and our Passive House Network chapter – Passive House Pennsylvania – have collaborated with local policymakers to initiate and implement the programs and incentives we’ve identified.
Carefully curated policymaker roundtables hosted annually by the Passive House Network (Frank and Gonzalves, 2016) since 2015 have further connected and encouraged regional policymakers to meet a growing demand by practitioners to design and deliver Passive House buildings.
Up and Coming Regions
Due to the lag time between project development and certification, we know that our current graphs are unable to communicate predicted Passive House growth in various regions. However, based on the policy patterns we’ve identified, we may reliably predict where Passive House will accelerate next. From our opening abstract statement referencing the (86) eighty-six multifamily buildings currently pursuing Passive House certification in Massachusetts, it is an obvious choice. Notably, the majority of those MA projects are affordable multifamily housing due to additional incentives already embedded in their LIHTC program (MassCEC PH Design Challenge 2019.) It’s worth providing a brief overview of the program in MA that is driving this exceptional growth in Passive House.
In 2019, a coalition of Massachusetts utilities established Mass Save as a consortium designed to deliver energy efficiency incentives. They devised the most comprehensive, unified, clearly articulated, Passive-House-specific incentive program, targeted directly at multifamily buildings we have yet seen. Their incentive package includes all three successful Passive House policy patterns: 1. a clearly identified target of certified Passive House; 2. workforce training subsidies and; 3. direct financial support for projects and teams. This program goes further and includes post-construction bonus payments for delivered performance.
Passive House Incentive Structure for Multi-Family (5 units or more)
| Incentive Timing | Activity | Incentive Amount | Max. Incentive |
|---|---|---|---|
| Pre-Construction | Feasibility Study | Up to 100% Feasibility costs | $5,000 |
| Energy Modeling | 75% of Energy Modeling costs | $500/Unit, max. $20,000 | |
| Pre-Certification | $500/unit | N/A | |
| Post-Construction | Certification | $2,500/unit | N/A |
| Net Performance Bonus | $0.75/kWh and $7.50/therm | N/A |
The Net Performance Bonus is calculated by determining the final pay for savings incentives and subtracting the pre- and final certification incentives. The result is the Net Performance Bonus.
Projects that pre-certify but do not achieve certification are eligible for the pre-certification incentive and Net Performance Bonus.
Projects over 100 units must be pre-approved by the applicable Sponsors of Mass Save.
Figure 6. Mass Save Table of Passive House Incentives. Source: https://www.masssave.com/saving/residential-rebates/passive-house-incentives
In Connecticut, EnergizeCT recently initiated a Passive House training subsidy program.10 We anticipate this will be followed by a project incentive subsidy program aimed at multifamily buildings, similar to that run by Mass Save.
Baseline Code & Passive House Intersection: An Apples and Oranges Story
During the course of reviewing the spectrum of policies driving Passive House across the continent, we identified a few places where Passive House had been inserted into local baseline code. This prompted us to review how that was working to further understand whether this was worth replicating elsewhere.
In the United States, the baseline energy code uses either ASHRAE’s 90.1 energy standard or the International Energy Conservation Code (IECC), with some states and local jurisdictions managing their own energy codes (e.g., California’s Title 24, Part 6). These baseline energy codes are structured similarly with prescriptive and performance path options to demonstrate compliance. We dug further into how standard codes were structured against how the Passive House Standard is structured, to find possible opportunities to synthesize or harmonize them. Our cursory analysis revealed the following major differences:
- Differing end goals and target markets: Baseline energy codes have evolved to provide a minimum bar for energy efficiency, while Passive House was designed for optimized delivery of ‘hygiene ventilation’ using building performance. These are vastly divergent end goals (compliance vs optimized design) aimed at two very different demographics.
- Differing structures: Energy codes advance in 3-5 year cycles, using publicly vetted stakeholder workshops often focused on specific building elements and products. Proposed improvements are required to meet cost-effectiveness criteria in order to be adopted. Passive House standards are defined by the Passive House Institute and administered via a global network of qualified certifiers.11 They are voluntary building standards advanced via a cooperatively owned & operated international entity.
- Different energy models: Model codes historically use U.S.-developed, open-source, whole building energy simulation programs such as EnergyPlus and EnergyPro. For updates to be adopted, ‘cost-effectiveness’ must be determined. These are often calculated using NREL’s BEOpt software package, with EnergyPlus as its calculation engine. Passive House certification requires the use of either PHI’s Passive House Planning Package (PHPP) or Fraunhofer’s WufiPassive.
In 2014 an NREL-funded study by German, Saddiqui, and Daikin indicated that BEOpt predictions may be insufficiently calibrated to accurately predict the performance of Passive House buildings. Conversely, the Passive House Planning Package (PHPP) provided more accurate predictions when compared to monitored outcomes. Similar challenges were found in another study conducted by the same team for California’s Codes and Standards. California’s CBEC-Res energy model (built on EnergyPro engine) was unable to capture multiple benefits typically accounted for in PHPP. (Frontier Energy, Misti Bruceri & Associates, 2019). These suggest that studies comparing Passive House performance to standard baseline code buildings should not rely solely on standard modeling engines because they are unable to fully capture their benefits.
Based on our comparison we determined that efforts to interject Passive House into the baseline code may not be as effective as we had hoped. We did find three regions where Passive House has been inserted as an alternate compliance pathway into baseline codes. These are Washington State, British Columbia, and Massachusetts. These regions all allow Passive House certification in lieu of standard baseline or reach code compliance, offering parallel pathways that effectively circumvent the barriers identified above. We noted that New York has not yet implemented an alternate Passive House compliance pathway, indicating this measure alone is insufficient to drive market acceleration.
Conclusions on Quilting Policies
Now that we have clearly identified a number of effective policy onramps for building decarbonization utilizing established Passive House standards as their baseline, our hope is that policymakers across all regions will replicate and scale these patterns. Monitored results are clearly showing that we can deliver on the ‘exciting prospects for progress’ so breathlessly articulated in 1997 by von Weizsäcker, Lovins, and Lovins in Factor Four, Doubling Wealth – Halving Resource Use. We recognize this happens most effectively in partnership with practitioners so we urge our policymaker colleagues to work closely with their Passive House community to simply replicate them in their regions. Together we can and must do better.
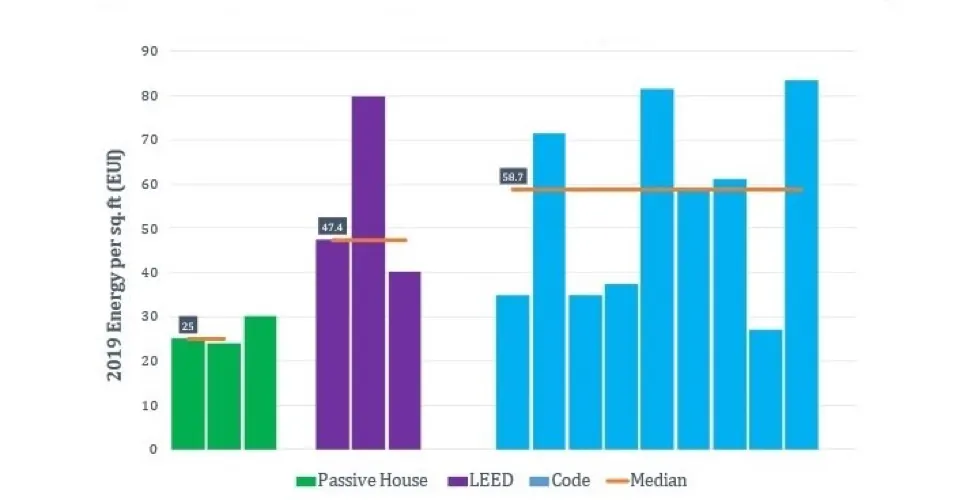
While undertaking this study, we were inspired by the broad array of policies referencing Passive House already in place across North America. It indicates growing confidence in using Passive House standards to promote deep building decarbonization. While we found many mentions of Passive House, we also identified a puzzling skepticism and probationary attitude towards its potential for broad-scale adoption. We were simultaneously disheartened to find many regions have not yet switched to outcomes-based programs where higher incentives are allocated according to delivered results. This is particularly damning given that the building-science principles that underpin the Passive House standard have been well known since the late ’70s (Dumont, Besant, Jones, Kyle, 1978.) Complaints of disjointed and ineffectual policies have similarly been blamed for the glacially slow pace of U.S. heat-pump adoption (Mills 2022.) This may hopefully start changing once more results from benchmarking regulations, like those shown in Figure 7 from Massachusetts, begin to reveal why incentives for voluntary programs should be weighted according to delivered outcomes.
Summary
Our study uncovered a number of insights into where project growth is escalating and why. Based on our analysis, we reached these conclusions:
- Financing incentive programs like NYSERDA’s Buildings of Excellence and Mass Save’s Passive House Multifamily Program that operate outside baseline code work best to nurture and accelerate Passive House growth.
- Policies and programs specifically focused on Passive House, work most effectively when they include professional training support, clear targets, and financial support to front runners. This de-risks adoption. Success appears to require that all three drivers be in place for Passive House development to accelerate.
- Baseline code and Passive House target different demographics, are incompatibly structured, and are not easily harmonized. Parallel programs, working outside baseline code, using stepped or weighted incentive structures allocated according to measured performance outcomes are more effective at generating rapid transformation. (PHFA’s LIHTC program, BC Step Code & Xcel Energy rebate programs are all examples of this tiered structure that allocates benefits according to outcomes.)
Notes
- Certified Passive House in this paper includes certifications issued by the Passive House Institute (PHI), Darmstadt, and the Passive House Institute US (PHIUS.)
- We chose to exclude non-certified projects because they are either incomplete or have not been third-party verified.
- Treated Floor Area (TFA) is more commonly used by Passive House due to a peculiarity built into the energy modeling packages for both certifications which calculate energy use by interior conditioned area. To estimate standard, exterior square footage, approximately 5% more may be added to these totals .
- We have published this full PHN Policy Benchmarking Report here: Policy Benchmarking Reference Document, June 2022 (PDF)
- The 15kWh/m² heating demand target is commonly associated with the international Passive House standard.
- Options for multiple training subsidies are searchable on the Passive House Canada website here: https://www.passivehousecanada.com/government-funding/
- Link to this program may be found here: https://www.nyserda.ny.gov/All-Programs/multifamily-buildings-of-excellence
- City of Vancouver list of Passive House incentives: https://aibc.ca/2020/04/city-of-vancouver-new-incentives-for-passive-house/
- Colorado’s electric utility supplier, Xcel Energy, recently issued a tiered, or step-structured incentive program for Marshall Fire victims, offering the highest rebate of $37,500 to owners who choose to rebuild certified Passive Houses, with incrementally lower rebates offered to other programs: https://www.xcelenergy.com/staticfiles/xe-responsive/Safety/Marshall%20Fire%20Rebates%20Info%20Sheet%20-4-15-22.pdf
- Source: https://energizect.com/trade-ally-home/passive-house-training
- With the exception of a U.S. derivative standard administered by PHIUS which operates independently.
Acknowledgements
This report was written by Bronwyn Barry, PHN’s Policy Lead, with the generous support, feedback, edits and input from the following members of the PHN Policy Committee:
- Steve Mann
- Ken Levenson
- Jonathan Fertig
- Cheryl Saldanha
- Jay Murdoch
- Craig Stevenson
PHN would also like to thank the members and allies who helped us crowd-source the list of existing Passive House-related and specific policies already in place in Canada and the U.S.
- PHN, CA – Bronwyn Barry
- PHN, NY – Ken Levenson
- MN – Tim Eian
- RM – Andrew Michler,
- NJ – Shawn Torbert and Justin Taylor, Gahl Spanier
- DC – Bo Green
- PA – Rob Hosken
- NYPH – Andreas Benzing, Stas Zakrezwski
- PHMA – Hank Keating
- PHnw – Mike Fowler
- Passive House Canada – Rob Bernhardt, Chris Ballard
- phME – Naomi Beal
- PHCA – Steve Mann
References
- Barry, B., et al, 2019, NAPHN Policy Resource Guide, NAPHN Policy Resource Guide, 2019 (PDF)
- Building Innovations Database, 2011, Brussels Exemplary Buildings Program + Passive House Law of 2011, https://www.buildinginnovations.org/policy/brussels-exemplary-buildings-program-passive-house-law-of-2011/
- Building Innovations Database, 2015 Passive House Tax Credit by Pennsylvania Housing Agency, https://www.buildinginnovations.org/policy/2015-passive-house-tax-credit-by-pennsylvania-housing-agency/
- City of Pittsburgh Press Release, Peduto Administration Legislation Requires New City Buildings to be Net Zero Energy Efficient, 2019 https://pittsburghpa.gov/press-releases/press-releases/3274
- City of Vancouver Policy for Green Buildings Policy for Rezonings, 2010 https://guidelines.vancouver.ca/policy-green-buildings-for-rezonings.pdf
- City of Vancouver Zero Emissions Building Plan, 2016 https://council.vancouver.ca/20160712/documents/rr2.pdf
- Dumont, R., Besant, R., Jones, G., and Kyle, R., 1978, Passive Solar Heating – Results from Two Saskatchewan Residences, London, Ontario: 4th Annual SESCI Conference Proceedings
- Frank, Y., and Gonzalves, A., 2016, Advancing Passive House Policy, BeEx, https://be-exchange.org/wp-content/uploads/2017/11/20161025_NAPHN_Policy_Briefing-1.pdf
- Frontier Energy, Inc., Misti Brusceri & Associates, LLc., 2019 Cost-effectiveness Study: Low-Rise Multifamily Residential New Construction Addendum – Passive House Equivalency Analysis for 2019 Energy Efficiency Ordinances, Table 1. Footnotes
- German, A., Saddiqui, B., and Daikin, B., 2014, Sunnyvale Marine Climate Deep Retrofit, Figure 19, Pg.25, NREL, https://www.nrel.gov/docs/fy15osti/63085.pdf
- Joyce, M., Wilhelm, M., March 2022, The Keys to Successful Passive House Implementation, Tierra Resource Consultants, https://passivehousecal.org/wp-content/uploads/2022/04/group_b_-d33_case-study_5_passive_house_success_stories_2022.03.21.pdf
- MA19R05: Residential New Construction Passive House Assessment – Overall Report – Final, 2020, Submitted to The Massachusetts Electric and Gas Program Administrators, NMR Group, Inc. https://ma-eeac.org/wp-content/uploads/MA19R05_PassiveHouse_OverallReport_Final_2020.01.06.pdf
- Massachusetts Clean Energy Center, 2019, Passive House Design Challenge, https://www.masscec.com/emerging-initiatives/passive-house#:~:text=The%20Passive%20House%20Design%20Challenge%20made%20awards%20of%20up%20to,less%20than%203%25%20cost%20premium
- Mills, E., 2022, Market spoiling and ineffectual policy have impeded the adoption of heat pump water heating for US buildings and industry, https://www.researchgate.net/publication/360010896_Market_spoiling_and_ineffectual_policy_have_impeded_the_adoption_of_heat_pump_water_heating_for_US_buildings_and_industry
- New York City Government, 2014, One City Built to Last, https://www1.nyc.gov/assets/builttolast/downloads/OneCity.pdf
- Washington State Energy Code – Residential 2018 Edition, Section R407, https://sbcc.wa.gov/sites/default/files/2021-01/2018%20WSEC_R%20Final%20package2.pdf
- von Weizsäcker, E., Lovins, A., and Lovins, L.H., 1998, Factor Four – Doubling Wealth, Halving Resource Use, London, UK: Earthscan Publications Limited